Seismic Refraction Survey Uganda

P-wave velocity profiling for bedrock depth, rippability, and foundation characterisation — the workhorse geophysical method for dams, railways, bridges, and irrigation schemes across Uganda and East Africa.

Request a Quote View Related Projects

What Is a Seismic Refraction Survey?

A seismic refraction survey is a geophysical method that measures the velocity of compressional seismic waves (P-waves) as they travel through subsurface layers. An energy source — typically a sledgehammer struck against a metal plate, a weight drop, or a small explosive charge — generates seismic waves at the surface. A linear array of geophones planted in the ground records the arrival times of the first seismic energy at each receiver.

Because seismic waves travel faster in denser, more competent material, the first-arrival times reveal the depth, thickness, and velocity of each subsurface layer. A seismic refraction survey in Uganda is the standard geophysical method for determining bedrock depth, assessing overburden thickness, evaluating rippability for excavation, and characterising foundation conditions for dams, bridges, railways, and industrial buildings.

Georesolve Africa has delivered seismic refraction surveys across Uganda, Rwanda, and Burundi for projects including the Arua Water Dam, the Standard Gauge Railway corridor, the Tororo–Amagoro irrigation scheme, and nuclear facility site characterisation in Soroti. Our crews use multi-channel seismographs with high-resolution geophones and process data using refraction tomography software to produce continuous 2D velocity models of the subsurface.

How a Seismic Refraction Survey Works

  1. Survey design. Seismic lines are laid out along the alignment or area of interest. The line length and geophone spacing are chosen based on the target depth — longer lines and wider spacing for deeper targets, shorter lines and closer spacing for shallow resolution.
  2. Geophone deployment. Vertical geophones (typically 10–14 Hz) are planted in the ground at regular intervals along each line. A multi-channel seismograph connects to all geophones simultaneously via spread cables.
  3. Energy source. Seismic waves are generated at multiple shot points along and off the ends of the spread. A sledgehammer and plate is used for shallow investigations; a weight drop or small charges are used for deeper penetration. A trigger sensor records the exact shot instant.
  4. Data recording. The seismograph records the seismic signal from each geophone for each shot, producing a shot gather — a plot of arrival time versus distance.
  5. First-arrival picking. The first-arrival time of seismic energy at each geophone is picked (manually or semi-automatically) for every shot point. These picks form the basis of the velocity model.
  6. Tomographic inversion. First-arrival times are inverted using refraction tomography software to produce a continuous 2D P-wave velocity cross-section along the line, showing layer boundaries, velocity gradients, and geological structure.
  7. Interpretation & reporting. Velocity cross-sections are interpreted in the geological context of the project — mapping bedrock surface, overburden thickness, fracture zones, and rippability classes. A technical report with cross-sections and GIS layers is delivered.

Equipment

ComponentSpecification
SeismographMulti-channel engineering seismograph (24 or 48 channel) with high-resolution 24-bit ADC and stacking capability for improved signal-to-noise ratio
GeophonesVertical-component geophones, 10–14 Hz natural frequency, planted at 2–5 m spacing along the spread
Energy sourceSledgehammer and aluminium strike plate (shallow), accelerated weight drop (intermediate), or small explosive charges (deep). Multiple stacks per shot point to improve signal quality
TriggerPiezoelectric or mechanical trigger switch on the energy source, providing microsecond-accurate shot timing to the seismograph
CablesMulti-conductor spread cables connecting geophones to the seismograph, with roll-along capability for continuous profiling
ProcessingRefraction tomography software (e.g. Rayfract, SeisImager) for first-arrival picking, tomographic inversion, and 2D velocity model generation

Applications

Bedrock Depth

Determine depth to competent bedrock for foundation design, pile length estimation, and excavation planning.

Rippability Assessment

Classify bedrock excavatability — rippable, marginal, or requiring blasting — for earthwork cost estimation.

Dam Foundations

Characterise abutment and valley-floor conditions for dam feasibility and design.

Transport Corridors

Profile railway and road alignments for cut-and-fill optimisation and earthwork design.

Site Classification

Determine seismic site class (Vp-based) for building code compliance and seismic hazard assessment.

Groundwater

Map aquifer boundaries, weathered layer thickness, and fracture zones for borehole siting.

Deliverables

Case Study: Seismic Refraction for Arua Water Dam, Uganda
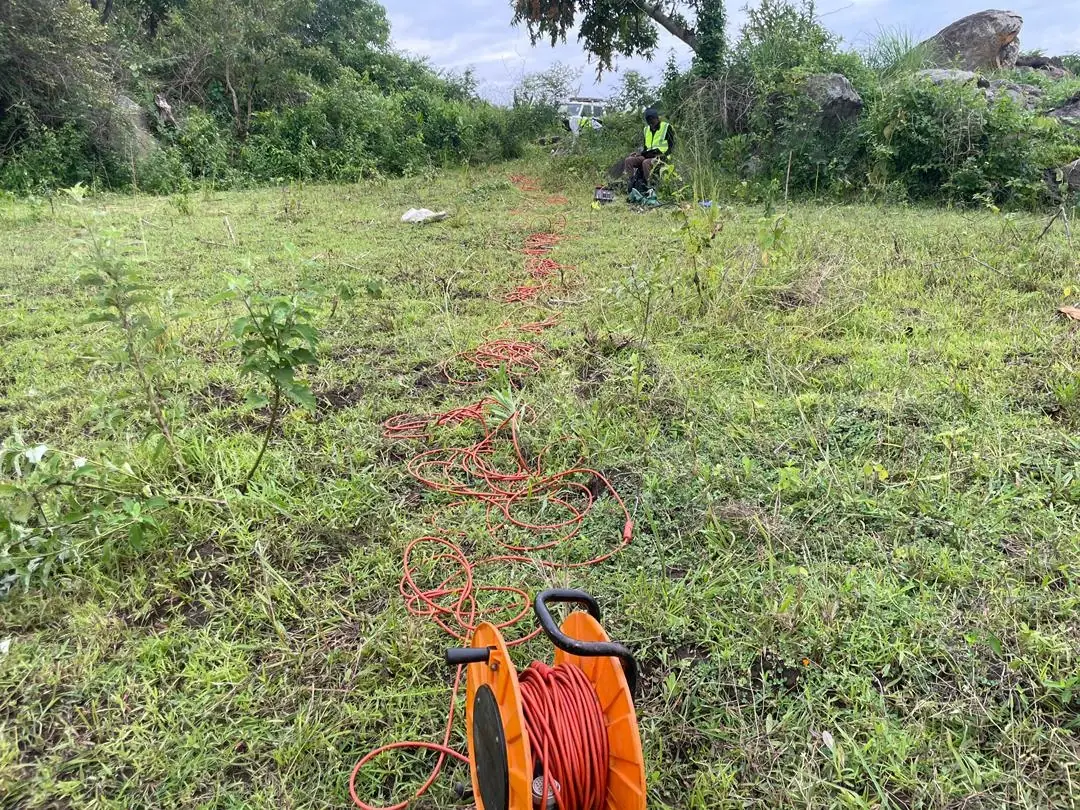
Seismic refraction survey at Arua Water Dam, Uganda

Geological and Geotechnical Investigations for Arua Water Dam

Location: Arua, Uganda Year: 2025 Client: Fichtner GmbH & Tectoni Africa Ltd

Georesolve delivered 1.5 km of Seismic Refraction surveys combined with 5.5 km² of geological mapping for the Arua Water Dam project. The seismic refraction data provided P-wave velocity profiling to characterise the dam foundation conditions, determine bedrock depth, and assess the rippability of the substrate along the dam axis and spillway alignment.

The integrated geological and geophysical dataset supported the feasibility assessment and engineering design of this major water supply infrastructure project for the West Nile region of Uganda.


View this and other projects in our portfolio →

Frequently Asked Questions

What is a seismic refraction survey?

A seismic refraction survey is a geophysical method that measures the speed of seismic P-waves (compressional waves) as they travel through subsurface layers. An energy source (hammer, weight drop, or explosive) generates seismic waves at the surface, and an array of geophones records the arrival times. Because waves travel faster in denser material, the first-arrival times reveal the depth and velocity of each subsurface layer, mapping bedrock depth, overburden thickness, and geological boundaries.

What can seismic refraction detect in Uganda?

Seismic refraction is used in Uganda for bedrock depth determination, overburden thickness mapping, rippability assessment for excavation, seismic site classification for building codes, dam foundation characterisation, railway and road corridor profiling, pipeline route assessment, and groundwater exploration. It is one of the most widely applied geophysical methods for infrastructure projects across East Africa.

How deep can seismic refraction see?

The investigation depth of a seismic refraction survey depends on the line length and energy source. With a standard 24-channel array and a sledgehammer source, depths of 15 to 30 metres are typical. Longer spreads and heavier energy sources (weight drop or explosives) extend the depth to 50 metres or more. The method requires each successive layer to have a higher velocity than the one above it.

What is the difference between seismic refraction and seismic reflection?

Seismic refraction analyses waves that bend (refract) across layer boundaries and travel along the fastest path to the geophones. It is ideal for shallow investigations up to about 50 metres and for mapping layer velocities. Seismic reflection analyses waves that bounce off layer boundaries and return to the surface, providing higher-resolution images of deeper structures. Refraction is more common for engineering and shallow investigations; reflection is used for deeper oil and gas or crustal studies.

What is rippability assessment?

Rippability assessment uses seismic refraction P-wave velocities to determine whether bedrock can be excavated by a ripper (mechanical excavator) or requires blasting. Velocities below 1500 m/s are typically rippable, 1500 to 2400 m/s are marginally rippable, and above 2400 m/s generally require blasting. This information is critical for earthwork cost estimation on infrastructure projects in Uganda and East Africa.

How much does a seismic refraction survey cost in Uganda?

The cost of a seismic refraction survey depends on the total line length, number of lines, site access, energy source required, and the level of interpretation and reporting. Georesolve Africa provides tailored quotes based on project-specific requirements. Contact us with your project area and objectives for a detailed proposal.

Related Services

Need to Map Bedrock or Foundation Conditions?

Talk to Georesolve Africa about a seismic refraction survey for your dam, railway, bridge, or infrastructure project in Uganda and East Africa.

Request a Quote

Trusted by Leading Organizations

GeoResolve partners with government agencies, consulting firms, and private sector clients across East Africa